Managing by the Number (Pt II)
Part II: I’ll admit I was fairly proud at the advances made in tracking the team's success. My employees were more engaged in their work (as compared in previous years...
Traveler // Knowledge Lover // Data Guy
Living on the west coast comes with many perks. Aside from In-N-Out and football starting at 10 o’clock in the morning, I love being close to so many national parks and forests. My affinity for the outdoors began with my time in Boy Scouts and it continues today.
So where do these national treasures fit into the world of data analytics? Why should we look to numbers about an outdoor experience where many of us intentionally try to avoid a Wi-Fi signal?
On my last trip to Tahoe National Forest I began to wonder about what data is available that could provide some useful…or at least interesting insight into the travel trends of guests to national parks.
After a quick search I found a great resource provided by the Recreation Information Database which contains data on all visits to a national park or recreation area with a reservation for a shelter, campsite, hiking permit, etc…[1] The records go back to 2006, but I focused on data from 2015… here’s what I found:
Top 10 Most Popular Parks by reservation (you can search your for favorite park too!):
[table id=2 /]
I know you might be thinking “What about Yellowstone? Grand Teton?” Yellowstone camping reservations are run through a non-government third party company (www.xanterra.com) and Grand Teton came in at 12th on the list. Also, remember this data tracks reservations, not total visitors.
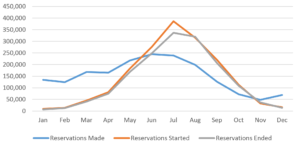
It’s no secret visitations to national parks break visitation records every year. This graphic gives us insight into the volume of reservations being made:

As you might expect the peak visitation months are summer to early fall (June – September). You might also notice how the start and end date lines overlap nearly completely – the average reservation length is 3 days…I’ll let you guess the most popular beginning and ending reservation dates!
Back to our most popular parks – if they are on your bucket list for next summer you might want to start booking your trip now, here are the average lead times of how far in advance most people book their trip:
| Park / Permits | Average Lead Time for Reservation (days) |
| Mather Campground (South Rim Grand Canyon National Park) | 51 |
| Boundary Waters Canoe Area (northern Minnesota) | 82 |
| Upper Pines Campground (Yosemite National Park) | 74 |
| Watchman Campground (Zion National Park) | 84 |
| Inyo National Forest (Sierra Nevadas) | 34 |
| Cables on Half Dome – hiking permit (Yosemite National Park) | 73 |
| Fort Pickens Campground (Pensacola Beach, FL) | 46 |
| Blackwoods Campground (Acadia National Park) | 47 |
| Moraine Park Campground (Rocky Mountain National Park) | 80 |
| Elkmont Campground (Gatlinburg, TN) | 57 |
Travel Hint!: While the most popular parks aren’t exactly a last-minute getaway, you’ll notice very few reservations are made in Nov/Dec for the proceeding year. This is the primetime to lock in your trip!
As I was sifting through data, the next question to hit me was… where are all these people coming from?
Interestingly enough, about 64,600 (or 3.7%) of reservations are made by non-US citizens; about half of whom are from Canada and Germany. These guests are well spread out across all parks but the Grand Canyon (south rim) is the clear favorite. Like they say…the Grand Canyon is one of the few things in life that does not disappoint when you see it!
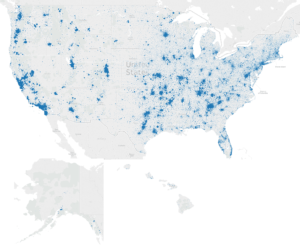
As far as the locals (US citizens) the map below shows the cities where all reservations originated.

While anyone would expect large numbers of reservations to come from cities (major population centers) it is interesting to see the areas not around major cities such as middle-America (Oklahoma, Missouri, Arkansas). Also, the west coast is clearly more outdoorsy than the rest of the country. And in case you were wondering, here are the top 10 cities of true outdoorsmen/women and where they prefer to get away:
| City/Zip | Number of Reservations | Top Destination |
| Bend, OR 97701/97702 | 4,622 | Cinder Hill Campground (OR) |
| San Francisco, CA 94110/94117 | 3,861 | Point Reyes Nat’l Seashore (CA) |
| Bozeman, MT 59715/59718 | 2,438 | Hood Creek Campground (MT) |
| Livingston, Tx 59718 | 1,909 | Jim Hogg Park (TX) |
| Juneau, AK 99801 | 1,743 | Mendenhall Campground (AK) |
| Portland, OR 97202 | 1,596 | Lost Lake Resort and Campground (OR) |
| Davis, CA 95616 | 1,546 | Desolation Wilderness (CA) |
| Folsom, CA 95630 | 1,537 | Fallen Leak Campground (CA) |
| Ely, MN 55731 | 1,521 | Boundary Waters Canoe Area (MN) |
| San Diego, CA 92109 | 1,514 | Cedar Creek Falls (CA) |
Many of the above sites are little corners in notable parks like Yosemite or Tahoe National forest. This is where a little data can go a long way. Knowing the optimal times to avoid a crowd and when to book your trip can make all the difference. Also, where some of these parks are hundreds of square miles, it can help to find your little slice of heaven.
If you want to know more about a park or need help planning an upcoming trip – drop me a line!
Happy trails!

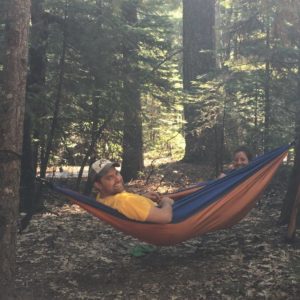
My better half an I enjoying the shade at White Cloud Campground!
About the data: Over 1.8M lines of data for 2015 national park and recreation reservation data was pulled from https://ridb.recreation.gov/. The data was cleansed using Notepad and Notepad++. Data queries were processed in PostgreSQL.
[1] “National Parks” refer to all national parks, forests, recreation sites and other nationally maintained facilities.