Data Mining Our National Parks
Living on the west coast comes with many perks. Aside from In-N-Out and football starting at 10 o’clock in the morning, I love being close to so many national parks...
Traveler // Knowledge Lover // Data Guy
Part I:
At the age of 24, I was promoted to my first managerial role. My boss at the time came down to congratulate me as I was moving into my new office – yes an office…with an actual door. He shared some warm platitudes with me shared some advice, he said: “You know Dave, managing people is some of the most rewarding and messiest work you can ever do. Just don’t forget at the end of the day, it’s all about the people.”
I don’t think anyone is truly prepared for their first managerial role (looking back, I sure wasn’t) and over the next four years in that position I learned many lessons which I keep with me today.
Being a numbers guy I was excited to bring a numbers approach to management; but there is a fine line all data nerds must walk: the balance of using data to make decisions without reducing every situation to a cold data point on a graph. In general people appreciate seeing data related to their performance, but there is no statistical model that can accurately capture all nuances of the human “X” factor.
This is exactly the challenge I faced as a new manager. The team I oversaw was a group of regional managers at a non-profit organization; each person was responsible for the performance of 15-20 branches each. Unfortunately our organization had little data to share in the way of employee performance. Knowing this data could drive significant performance, I went to work building a performance scorecard[1].
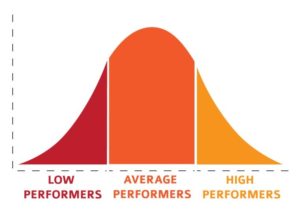
 The inspiration for building the model came from a consulting firm where employees were assessed on a five point scale; one for ‘poor performance’ up to five for ‘outstanding performance’. I liked the concept because of its simplicity and a five-point scale easily lends itself to a natural bell curve.
I wanted to take the model a step further however and provide my team members with insight into how/why their score was what was being reported.
To begin I had to define what I wanted to measure, which is a careful idea to ponder because once you communicate these areas to employees they become the focus of his or her work. I had to make sure the areas were truly important to the organization and not feel good “busy work”. I ended up with two categories:
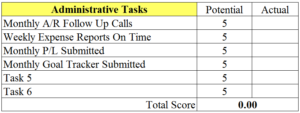
Administrative work: These were secondary responsibilities like following up on accounts receivable calls to keep AR days and balances short or submitting expense reports on a timely basis to keep things running smoothly with accounting.
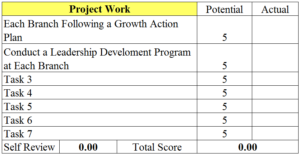
Project work: These were the primary job responsibilities such as following plans to achieve performance goals within their territory.
With input from others I also added a third category: professional development, in an effort to encourage the staff to pursue interests that would further their careers.
Within each category we (the team and I) agreed upon what needed to be achieved to be successful. We ended up with an evaluation guide similar to this:


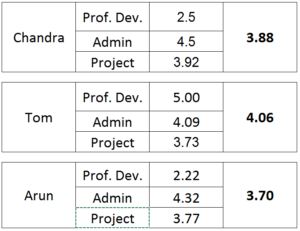
With the help of a few colleagues, I developed a weighted average equation across all areas to give credit to all the work being accomplished but giving more weight to the work that was most important to the organization. To display the results we developed an overall scorecard that was hosted online so it could be updated in real time. This is what it looked like:

A few things I should point out here – first, since the scorecard was hosted on Google Drive we gave all employees access to the overall scores, but kept actual identities anonymous. This was a risk for sure but it ended up creating an attitude of collaboration and accountability. Employees could see on their own score and how they were performing compared to their peers.
I made sure to use this as a knowledge sharing tool rather than pure competition; I would make connections between employees to pair up a person who was struggling with a higher performing teammate so they could learn from each other. Also, since the tool updated in real time based on their work, there were no surprises when the review period came around.
After several weeks of trial and error I finally found the right combination of factors to assess each person’s performance. While this was powerful data at the induvial level, this also provided a wealth of data which helped me manage the team at a higher level.
[1] In the interest of anonymity, the scores and actual names of the employees have been altered, however the insights, applications, and themes are those actually used by the organization.