Managing by the Numbers (Pt I)
Part I: At the age of 24, I was promoted to my first managerial role. My boss at the time came down to congratulate me as I was moving into...
Traveler // Knowledge Lover // Data Guy
A while back I had the interesting challenge of figuring out how to reduce patient length of stays in a hospital…here’s how it went…
First, let’s review a quick and dirty lesson about how hospitals get paid for their services. Medicare is the largest healthcare payer accounting for an average of 40% of a hospital’s payer mix, followed by private insurance, Medicaid, and other payers. For a typical inpatient stay Medicare (and most insurance programs) outline a prescribed reimbursement amount for certain procedures or disease state management.
A hospital will get reimbursed a certain amount for an appendectomy which might result in a two day stay versus a hip replacement which might be four to five days. If a patient stays within their projected recovery time all is good; the patient goes home happy and the hospital makes money and can open its doors the next day. When patients extend their stay unnecessarily this can result in a significant negative financial impact on the hospital.
From a clinical standpoint, a patient’s stay in a hospital is a delicate balance of figuring out how long a person needs this type of concentrated care and when they are ready to be discharged. From an administration perspective, the concern is how to achieve the clinical mission of patient care without losing money on hospital length of stay.
Last year I worked with a hospital CFO who wanted to have a better understanding of the hospital’s average length of stay (ALOS). Given his hospital was a 550 bed facility with 19,000 inpatient admissions in a year, this was a real concern. With the hospital’s cost being ~$1,500[1] per patient per day, if 10% of the cases in a year stayed at least one day longer than they should, it could result in $2.9 million in unreimbursed expenses.
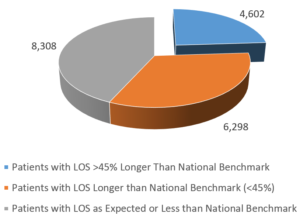
 After reviewing the data I found the problem was actually much worse. After a quick analysis, I found 24% of the hospitals patients stayed 40% or LONGER than the national average[2]. Knowing I wanted to employ the 80/20 principle, this gave me a good starting point to figure out where we could direct our energy.
 Throughout this project I was also thankful to have the support of a physician champion who worked at the hospital (I’ll call her Dr. S) at the hospital. Dr. S was able to provide advice as I cut through the data to inform me where we might be able to shift practices from a clinical perspective. She was also invaluable toward the end of the project when we needed to have discussions with physicians…but I’ll touch on that in a bit.
At this point I was able to isolate the most egregious cases, but Dr. S and I needed to whittle the data down further. Also, with over 130 affiliated physicians we needed to be targeted in who we would approach with this data. Physicians tend to have a sore spot for non-clinical professionals telling them how to practice medicine so we needed to be intentional about how we moved forward.
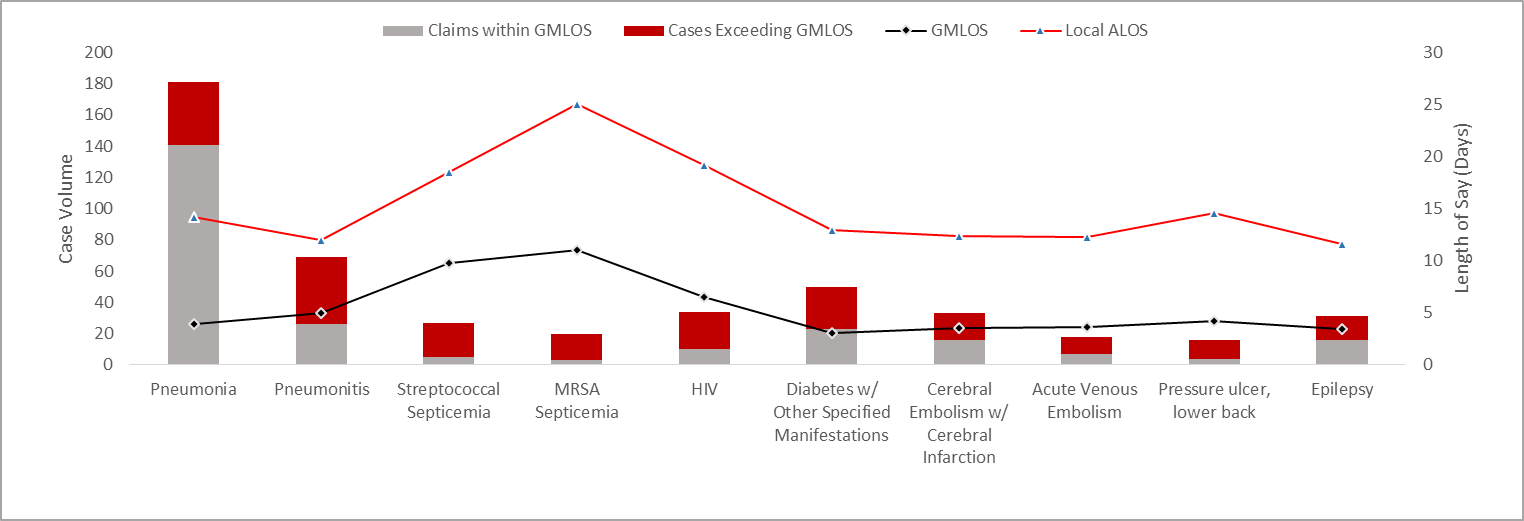
At the suggestion of Dr. S, we limited our focus to just hospitalist physicians[3] as they had the strongest connection to the administration. Staying within our cases that are ≥ 40% or longer than the benchmark LOS, we honed in on the top 10 types of cases with the worst ALOS data for the hospitalists. The Center for Medicare/Medicaid Services publishes annual case data including LOS for which they calculate a geometric average length of stay (GMLOS) to provide a more accurate benchmark. The results of the initial analysis are indicated here:

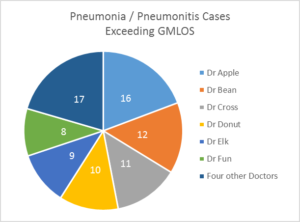
Dr. S and I determined if we were able to achieve just a 20% reduction in LOS across only these cases, the hospital could stand to save over $650K over the course of the next year. To get started we needed to find an easy win and we decided to focus on pneumonia and pneumonitis cases. Though these two disease states are not related (except by physical location) they represented the two most common cases with exceeding LOS seen by this physician group. Now to add some power to the data, we drilled down to the physician level to see the attending physicians who were driving the majority of the issue.
 Now we had the data we could use to provide feedback to the physicians. Dr. S pulled the medical records of past cases and reviewed notes to see where patients could have potentially been released sooner or where complications should have been noted to justify longer LOS. This also allowed her to have more targeted conversations with the physician team. Instead of blasting all 130 physicians with an email no one would read, she could meet individually with Dr. Apple, Bean, and Cross and discuss actual examples and provide specific suggestions.
Over the next several weeks of providing feedback, Dr. S started to see a slight decrease in LOS for all these physician’s patients. The team was on their way toward hitting their 20% reduction goal.
Physicians must balance a myriad of variables in order to successfully treat their patients. In this case we were able to use data to show physicians where their results were trending against their peers’ average. No, this didn’t result in every patient being sent home a day earlier, instead it encouraged physicians to discuss the findings with their colleagues to determine where they might improve their practices and thus help their patients get well more quickly.
This project was interesting and challenging in many ways, but I also found it fulfilling to see the impact data can have on influencing the quality of healthcare.
[1] http://www.beckershospitalreview.com/finance/average-cost-per-inpatient-day-across-50-states.html
[2] https://www.cms.gov/Medicare/Medicare-Fee-for-Service-Payment/AcuteInpatientPPS/FY2015-IPPS-Final-Rule-Home-Page-Items/FY2015-Final-Rule-Tables.html
[3] A hospitalist is a physician who is directly employed by the hospital instead of simply having practice rights. This group was the most appropriate to work with since their professional connection was with the hospital.